
Flow Jo (BD Biosciences)
- Details
- Proprietary software
Unique solution for flow analysis and advanced data analysis. Compatible with all cytometer data files.
- Available at MRI-IGMM (dongle) and at l’IGH
- https://www.flowjo.com/solutions/flowjo

The facility provides access to proprietary analysis software, open source software and tools developed in house. We also provide access to deep-learning solutions including the training on your own data on our machines.

Unique solution for flow analysis and advanced data analysis. Compatible with all cytometer data files.

Flowing Software is a free flow cytometry data analysis software for Windows. The project combines high throughput data analysis with flowing usability. The easy-to-use visual interface ensures an effective data analysis with your personal computer!
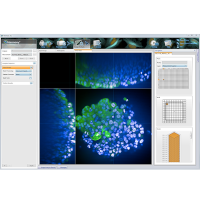
Harmony allows the offline-analysis of images coming from the opera automated microscope. Designed for biologists, Harmony’s workflow-based interface makes the whole process of high-content analysis straightforward, even for new users with little microscopy or programming knowledge.
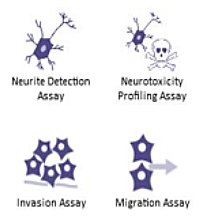
Software for analyzing images from automated plate acquisition systems. Allows dynamic measurements at cell, field and well level.

Image deconvolution, visualization and analysis software.

2D et 3D image processing and analysis software. Build on plugins, icy also provides the possibility to create ones own analysis protocols using visual programming. Scripts can be written in python and javascript.

ILASTIK is an easy to use, open source, machine learning software. Different machine learning modules for segmentation (pixel classification), object classification and counting are available

3D image reconstruction and 3 and 4D image analysis software. Imaris consists of common modules like the surface rendering and the tracking and of specific modules with a limited number of available licenses like ImarisXT, Filament tracer or Cell. Imaris can interact with FIJI and via the XT module with matlab and python.

STED analysis software. Allows to visualize and manipulate multidimensional ABBERIOR images.
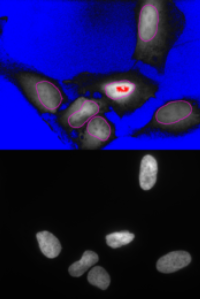
The tool calculates the ratio of the intensity in the nuclei and the cytoplasm. It needs two images as input: the cytoplasm channel and the nuclei channel. The nuclei channel is used to segment the nuclei. The measurements are made in the cytoplasm channel after the background intensity has been corrected.
Download and further informations: Intensity Ratio Nuclei Cytoplasm Tool on github
A number of image processing and analysis software packages are available on our analysis computers. Please contact us if you need help with on of the software packages.
A number of open source image analysis software packages are available on our computers. Other open source packages can be installed on demand. Most of our computers are equipped for 3D/4D processing and also for training and applying deep learning solutions. If you need help with a open source image analysis software please contact us.
Analysis tools and extensions developed at MRI. You can find the complete list of publicly available tools we developed in our github. Please contact us if you have an unsolved image analysis problem. We can either point you to already existing solutions of develop a custom tool for you.
We developed a tool dl4mic, that allows are users to train and run deep learning solutions from a graphical user interface integrated into FIJI/ImageJ. Currently 4 network-models are available within the tool: UNet, Dense-UNet, Noise2Void and Stardist. The tool allows to quickly integrate further models. For cell-segmentation we propose Cellpose. Cellpose is already trained with a large number of cell images and can often be used without further training. Our version of cellpose allows to run batch processing from within the graphical user interface.